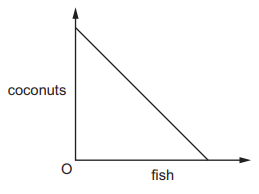
The diagram shows the production possibility curve of a desert island economy where the inhabitants live off just two commodities, coconuts and fish.
What explains the shape of the production possibility curve?
1 )
Coconuts and fish are in joint demand.
2 )
Coconuts and fish are perfect substitutes when consumed.
Fishing and coconut growing are equally efficient.
4 )
The opportunity cost of fish falls as more time is devoted to fishing.
تحلیل ویدئویی تست
منتظریم اولین نفر تحلیلش کنه!


پرسش و پاسخ های مشابه
سوال کنید یا به سوالات دیگران پاسخ دهید ...