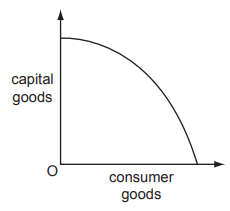
The diagram shows the production possibility curve of an economy.
Which statement explains the shape of this curve?
1 )
More efficient workers are drawn away from the production of consumer goods.
2 )
Resources cannot be switched between producing capital and consumer goods.
3 )
The economy is more efficient at producing capital than consumer goods.
The opportunity cost of producing capital goods increases the more capital goods are made.
تحلیل ویدئویی تست
تحلیل ویدئویی برای این تست ثبت نشده است!


