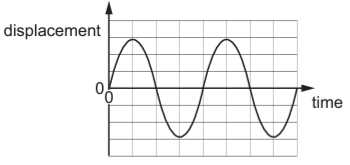
The graph shows the variation of the displacement of an air particle with time as a sound wave passes through air.
The intensity of the sound is halved while the frequency remains constant.
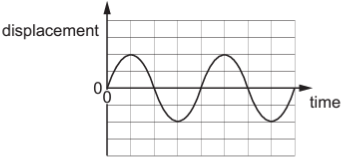
The four graphs below are drawn to the same scale as the graph above.
Which graph shows the displacement of the air particle?
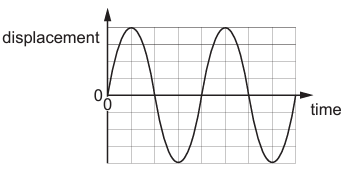
1 )
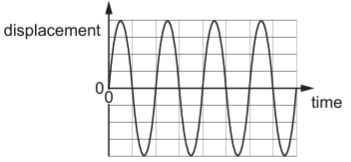
2 )
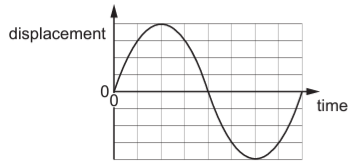
3 )
تحلیل ویدئویی تست
منتظریم اولین نفر تحلیلش کنه!


پرسش و پاسخ های مشابه
سوال کنید یا به سوالات دیگران پاسخ دهید ...