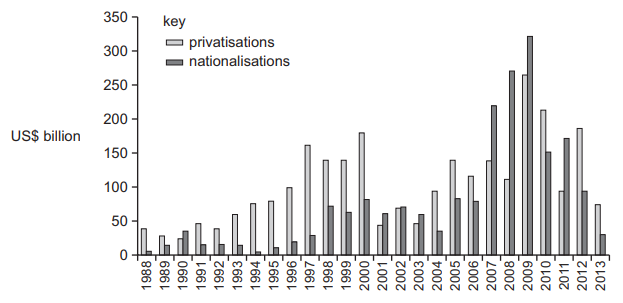
Governments reduce their stock of assets by privatisation. They increase their stock of assets by nationalisations. The diagram shows global sales of state-owned assets and global state purchases of private stock between 1988 and 2013 in US$ billion.
What can be concluded from the diagram?
1 )
By the end of the period the private sector owned more assets than the state sector.
Over the period governments raised more revenue from privatisations than they spent on nationalisations.
3 )
The first year in which nationalisations exceeded privatisations was 2007.
4 )
The greatest annual increase in government ownership of assets was in 2009.
تحلیل ویدئویی تست
منتظریم اولین نفر تحلیلش کنه!


پرسش و پاسخ های مشابه
سوال کنید یا به سوالات دیگران پاسخ دهید ...