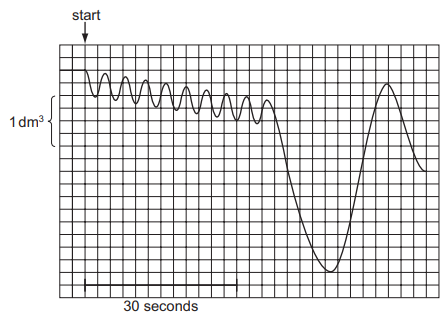
The diagram shows a record of a person’s breathing. The person breathed normally at the start, breathed in as deeply as possible and then breathed out as much as possible.
What is a valid conclusion from the graph?
1 )
The person breathed in $1000c{m^3}$ during the first 50 seconds.
2 )
The person was carrying out strenuous exercise for the first 30 seconds.
3 )
The rate of breathing for the first 30 seconds was 18 breaths per minute.
The tidal volume was $500c{m^3}$, the vital capacity was $3750c{m^3}$.
تحلیل ویدئویی تست
منتظریم اولین نفر تحلیلش کنه!


پرسش و پاسخ های مشابه
سوال کنید یا به سوالات دیگران پاسخ دهید ...