The graph shows how the rate of an enzyme-controlled reaction changes with temperature.
What is happening within the temperature range marked X?
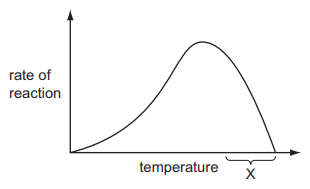
The enzyme is becoming denatured.
2 )
The enzyme is being used up.
3 )
The reaction is occurring at body temperature.
4 )
The reaction is occurring at the optimum temperature.
تحلیل ویدئویی تست
منتظریم اولین نفر تحلیلش کنه!


پرسش و پاسخ های مشابه
سوال کنید یا به سوالات دیگران پاسخ دهید ...