The diagram represents the original demand curve ${D_1}$ and the original supply curve ${S_1}$ for electric cars. The government decides to provide a subsidy to electric car manufacturers.
Which area represents the total revenue of the car manufacturer after receiving the subsidy from the government?
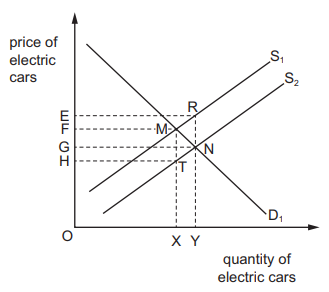
OERY
2 )
OFMX
3 )
OGNY
4 )
OHTX
تحلیل ویدئویی تست
منتظریم اولین نفر تحلیلش کنه!


پرسش و پاسخ های مشابه
سوال کنید یا به سوالات دیگران پاسخ دهید ...