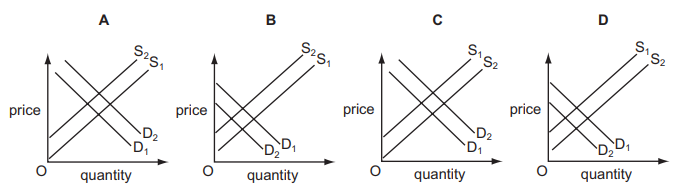
The diagrams show a change in demand from D1 to D2 and a change in supply from ${S_1}$ to ${S_2}$ for four different goods.
Which diagram illustrates the good for which additional new uses have been found and which receives an increase in government subsidy?
1 )
A
2 )
B
C
4 )
D
تحلیل ویدئویی تست
منتظریم اولین نفر تحلیلش کنه!


پرسش و پاسخ های مشابه
سوال کنید یا به سوالات دیگران پاسخ دهید ...