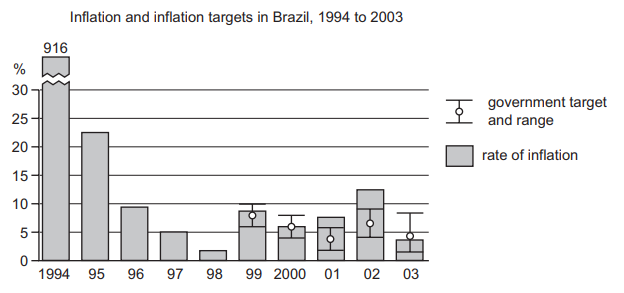
Before 1999 the Brazilian government did not have a desired target rate of inflation. From 1999 it set target rates within an upper and lower boundary.
The diagram shows the rate of inflation between 1994 and 2003 and the target rate between 1999 and 2003.
What can be concluded from the diagram?
1 )
The Brazilian government achieved its target in each year from 1999 to 2003.
2 )
The inflation target was continuously reduced.
3 )
The lowest level of inflation was achieved when an inflation target was used.
The inflation rate was more stable after inflation targets were introduced.
تحلیل ویدئویی تست
منتظریم اولین نفر تحلیلش کنه!


پرسش و پاسخ های مشابه
سوال کنید یا به سوالات دیگران پاسخ دهید ...