The following diagram shows the impact of a government subsidy for recycling waste which shifts the supply curve from S$_1$ to S$_2$.
Which one of the following areas measures the cost of the government subsidy?
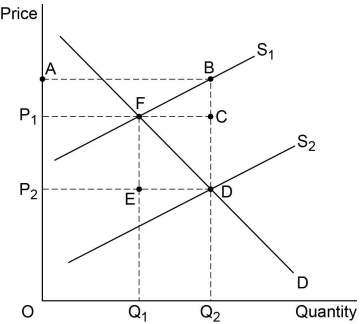
1 )
A B C P$_1$
A B D P$_2$
3 )
F C D E
4 )
P$_1$ C D P$_2$
تحلیل ویدئویی تست
تحلیل ویدئویی برای این تست ثبت نشده است!


پرسش و پاسخ های مشابه
سوال کنید یا به سوالات دیگران پاسخ دهید ...