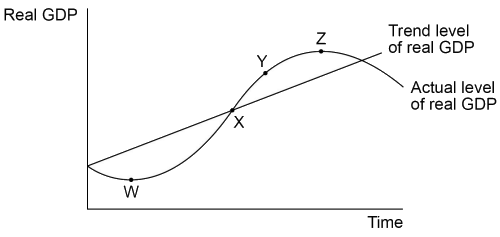
The diagram below shows an economic cycle and the trend level of real GDP. Which point represents the economy producing at its normal capacity level of output?
1 )
Point W
Point X
3 )
Point Y
4 )
Point Z
تحلیل ویدئویی تست
منتظریم اولین نفر تحلیلش کنه!


پرسش و پاسخ های مشابه
سوال کنید یا به سوالات دیگران پاسخ دهید ...