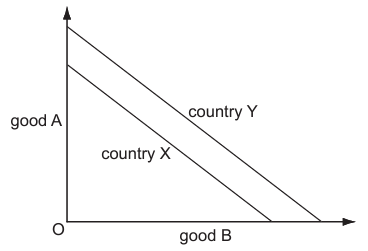
The diagram shows production possibility curves for two countries, X and Y.
What can be deduced from the diagram?
1 )
Both countries can benefit by specialisation.
2 )
Country X has a higher opportunity cost than Y in producing good B.
3 )
Country Y has a comparative advantage in both goods.
Trade between X and Y will not take place.
تحلیل ویدئویی تست
منتظریم اولین نفر تحلیلش کنه!


پرسش و پاسخ های مشابه
سوال کنید یا به سوالات دیگران پاسخ دهید ...