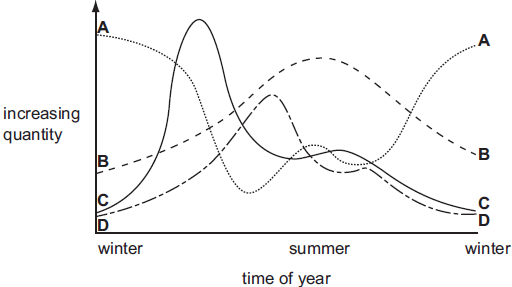
The graph shows the annual changes of the following factors in a lake.
intensity of light per day
numbers of producers
numbers of primary consumers
quantity of nutrients
Which curve represents the numbers of producers?
1 )
A
2 )
B
C
4 )
D
تحلیل ویدئویی تست
منتظریم اولین نفر تحلیلش کنه!


پرسش و پاسخ های مشابه
سوال کنید یا به سوالات دیگران پاسخ دهید ...