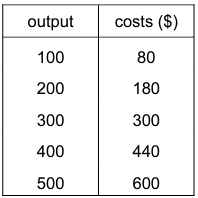
The table below shows the relationship between total output and total costs of a firm given constant factor prices and fixed factor proportions.
It follows that, over this range of output, the firm experiences
1 )
decreasing returns for output between 100 and 300 and increasing returns for output larger than 300.
2 )
increasing returns for output between 100 and 300 and decreasing returns for output larger than 300.
decreasing returns throughout.
4 )
increasing returns throughout.
تحلیل ویدئویی تست
منتظریم اولین نفر تحلیلش کنه!


پرسش و پاسخ های مشابه
سوال کنید یا به سوالات دیگران پاسخ دهید ...