The diagram shows Greece’s trade position with the EU and Russia between 2005 and 2014.
What can be concluded about the period 2005 to 2014?
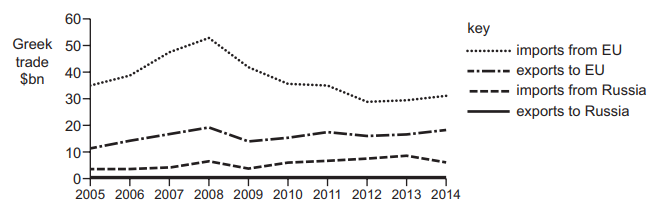
1 )
Greece’s annual trade deficit with the EU rose continuously.
Greece’s annual trade deficit with the EU was lower in 2014 than in 2005.
3 )
Greece’s annual trade deficit with the EU fell continuously.
4 )
Greece’s annual trade deficit with the EU was smaller than its deficit with Russia.
تحلیل ویدئویی تست
منتظریم اولین نفر تحلیلش کنه!


پرسش و پاسخ های مشابه
سوال کنید یا به سوالات دیگران پاسخ دهید ...