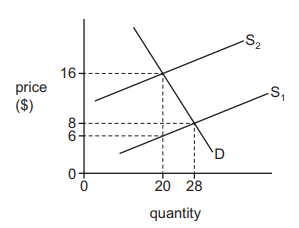
The diagram shows demand and supply curves for a good. ${S_1}$ is the original supply curve, ${S_2}$ is supply after a tax is added.
How much tax revenue is earned by the government?
1 )
$40
2 )
$160
$200
4 )
$320
تحلیل ویدئویی تست
منتظریم اولین نفر تحلیلش کنه!


پرسش و پاسخ های مشابه
سوال کنید یا به سوالات دیگران پاسخ دهید ...