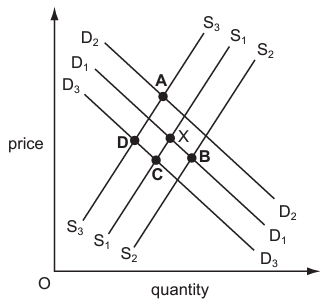
In the diagram below D1 and S1 represent the demand and supply curves of a Malaysian industry in its home market. Equilibrium is at X.
The industry has to pay a large wage increase and at the same time faces increased competition from imported substitutes.
Which point, A, B, C, or D, on the diagram could represent the new equilibrium?
1 )
A
2 )
B
3 )
C
D
تحلیل ویدئویی تست
منتظریم اولین نفر تحلیلش کنه!


پرسش و پاسخ های مشابه
سوال کنید یا به سوالات دیگران پاسخ دهید ...