درحال دریافت اطلاعات ...
{{ title }} با پاسخ {{ subtitle }}
-
Physics (9702)
- Chapter 1: Kinematics
- Chapter 2: Accelerated motion
- Chapter 3: Dynamics
- Chapter 4: Forces
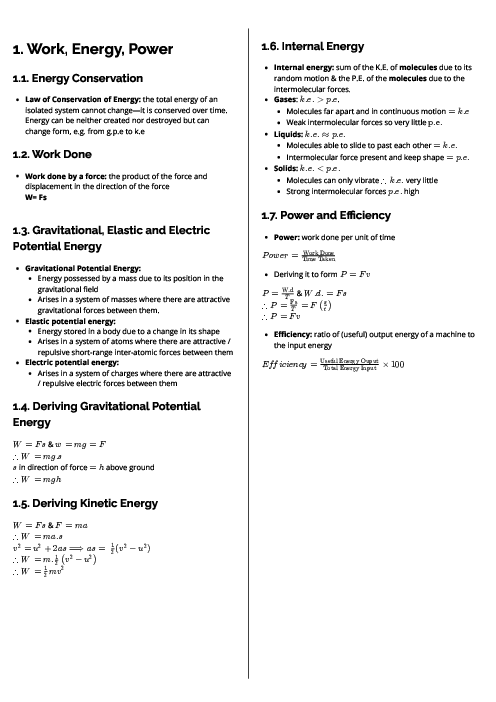
- Chapter 5: Work, energy and power
- Chapter 6: Momentum
- Chapter 7: Matter and materials
- Chapter 8: Electric current
- Chapter 9: Kirchhoff’s laws
- Chapter 10: Resistance and resistivity
- Chapter 11: Practical circuits
-
- Chapter 12: Waves
- Chapter 13: Superposition of waves
- Chapter 14: Stationary waves
- Chapter 15: Atomic structure
- P1 Practical skills at AS Level
- Chapter 16: Circular motion
- Chapter 17: Gravitational fields
- Chapter 18: Oscillations
- Chapter 19: Thermal physics
- Chapter 20: Ideal gases
- Chapter 21: Uniform electric fields
- Chapter 22: Coulomb’s law
- Chapter 23: Capacitance
- Chapter 24: Magnetic fields and electromagnetism
- Chapter 25: Motion of charged particles
- Chapter 26: Electromagnetic induction
- Chapter 27: Alternating currents


محتواهای آموزشی مشابه
فایل های پاورپوینت، ویدئو، صوتی، متنی و ...
پرسش و پاسخ های مشابه
سوال کنید یا به سوالات دیگران پاسخ دهید ...