
Enzymes Quiz (2) Biology AS Level
Cambridge
AS & A Level
Biology (9700)
فروردین
2010
شامل مباحث:
UNIT 3: Enzymes
تعداد سوالات: 20
سطح دشواری:
متوسط
شروع:
آزاد
پایان:
آزاد
مدت پاسخگویی:
25 دقیقه
پیش نمایش صفحه اول فایل
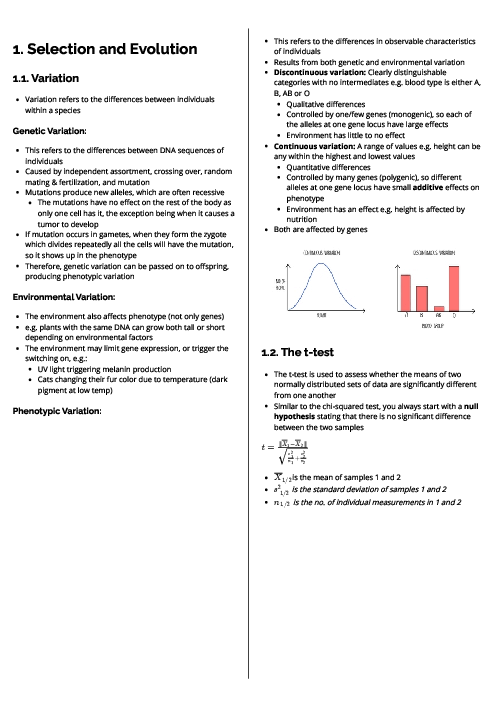
A student completed an experiment to measure how increasing concentrations of substrate affects the rate of an enzyme-controlled reaction.
The student then repeated the experiment after adding a fixed quantity of a reversible competitive inhibitor.
Which row describes the effect of a reversible competitive inhibitor on enzyme activity?


پرسش و پاسخ های مشابه
سوال کنید یا به سوالات دیگران پاسخ دهید ...