
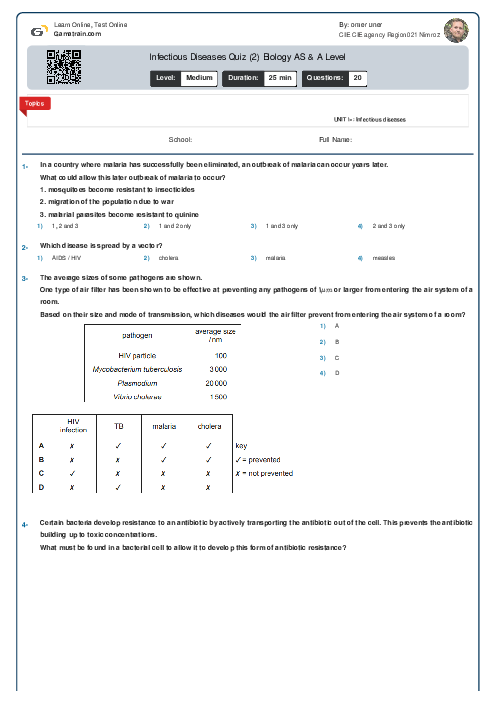
Infectious Diseases Quiz (2) Biology AS Level
Cambridge
AS & A Level
Biology (9700)
فروردین
2010
شامل مباحث:
UNIT 10: Infectious diseases
تعداد سوالات: 20
سطح دشواری:
متوسط
شروع:
آزاد
پایان:
آزاد
مدت پاسخگویی:
25 دقیقه
پیش نمایش صفحه اول فایل
The graph shows changes in the antibiotic resistance of a species of bacterium between 2000 and 2016 in one country. Samples of bacteria were collected every year from 48 hospitals. The bacteria were tested to see if they showed resistance to five different antibiotics.
What can be concluded from the data in the graph?


پرسش و پاسخ های مشابه
سوال کنید یا به سوالات دیگران پاسخ دهید ...