Paper 1 October/November 2008 Economics (9708/01) A Level
Cambridge
AS & A Level
Economics (9708)
بهمن
2008
مشاهده نمونه سوال
شامل مباحث:
AS Level
تعداد سوالات: 30
سطح دشواری:
متوسط
شروع:
آزاد
پایان:
آزاد
مدت پاسخگویی:
60 دقیقه

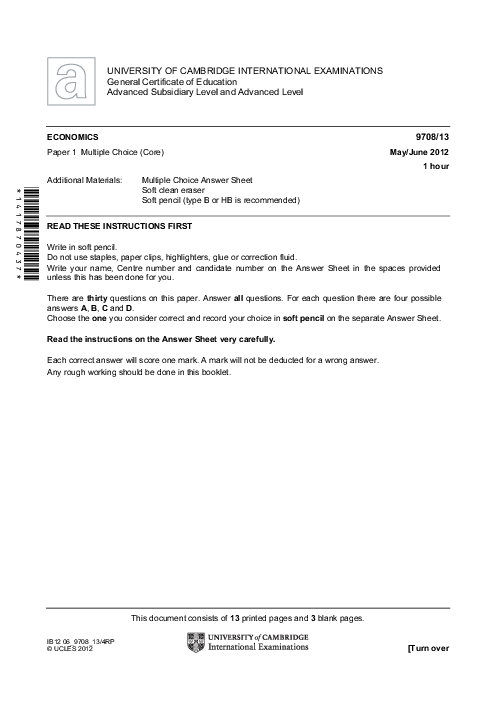
پیش نمایش صفحه اول فایل
What is the most abundant form of money (measured by value) in a developed economy?

