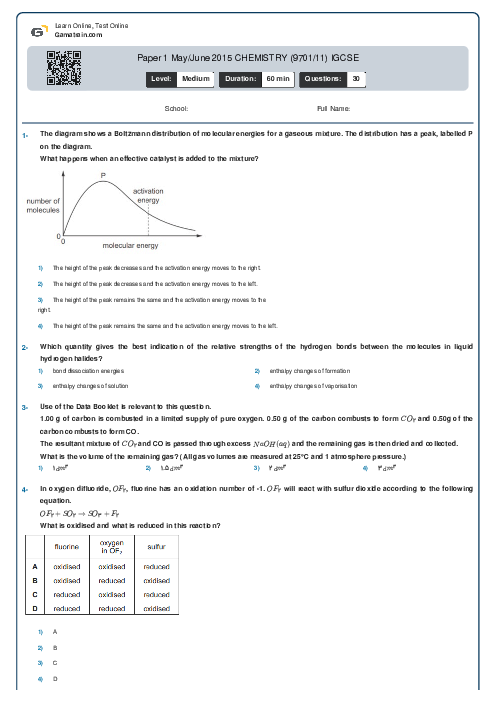
Paper 1 May/June 2015 CHEMISTRY (9701/11) IGCSE
Cambridge
AS & A Level
Chemistry (9701)
شهریور
2015
شامل مباحث:
تعداد سوالات: 30
سطح دشواری:
متوسط
شروع:
آزاد
پایان:
آزاد
مدت پاسخگویی:
60 دقیقه
پیش نمایش صفحه اول فایل
 Danial Naderi
ثبت شده در
29 دی 1401
Compound X can be oxidised to compound Y.
Compound Y gives a yellow precipitate with alkaline I$_2$(aq).
What is compound X?

پرسش و پاسخ های مشابه
سوال کنید یا به سوالات دیگران پاسخ دهید ...