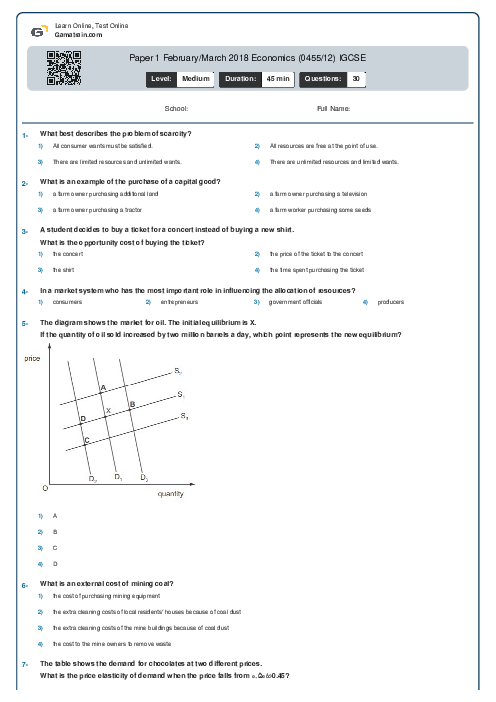
Paper 1 February/March 2018 Economics (0455/12) IGCSE
Cambridge
IGCSE
Economics (0455)
خرداد
2018
شامل مباحث:
تعداد سوالات: 30
سطح دشواری:
متوسط
شروع:
آزاد
پایان:
آزاد
مدت پاسخگویی:
45 دقیقه
پیش نمایش صفحه اول فایل
 Arefe Naderlouei
ثبت شده در
21 دی 1401
In low-income countries, fewer girls than boys become skilled design engineers.
What might explain this situation?


پرسش و پاسخ های مشابه
سوال کنید یا به سوالات دیگران پاسخ دهید ...