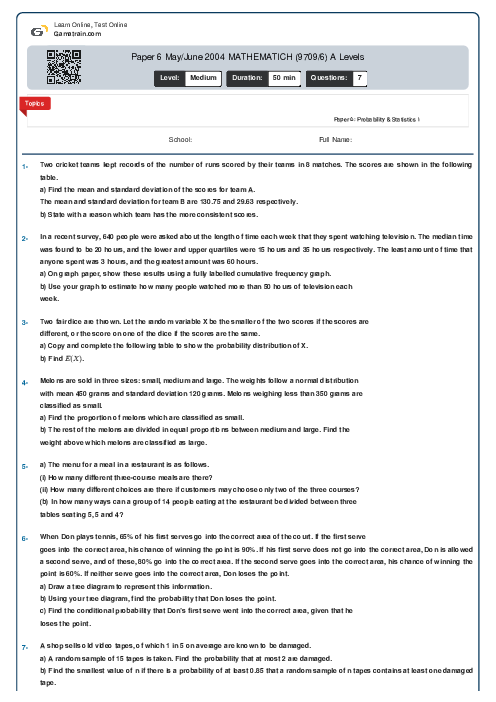
Paper 6 May/June 2004 MATHEMATICH (9709/6) A Levels
Cambridge
AS & A Level
Mathematics (9709)
شهریور
2004
شامل مباحث:
Paper 5: Probability & Statistics 1
تعداد سوالات: 7
سطح دشواری:
متوسط
شروع:
آزاد
پایان:
آزاد
مدت پاسخگویی:
50 دقیقه
رایگان
لطفا برای اطمینان از عملکرد و تجربه بهتر از مرورگرهای مدرن و به روز مانند کروم یا فایرفاکس استفاده کنید.
پیش نمایش صفحه اول فایل
 Danial Naderi
 In a group of 30 teenagers, 13 of the 18 males watch ‘Kops are Kids’ on television and 3 of the 12 females watch ‘Kops are Kids’.
a) Find the probability that a person chosen at random from the group is either female or watches ‘Kops are Kids’ or both.
b) Showing your working, determine whether the events ‘the person chosen is male’ and ‘the person chosen watches Kops are Kids’ are independent or not.

محتواهای آموزشی مشابه
فایل های پاورپوینت، ویدئو، صوتی، متنی و ...
پرسش و پاسخ های مشابه
سوال کنید یا به سوالات دیگران پاسخ دهید ...