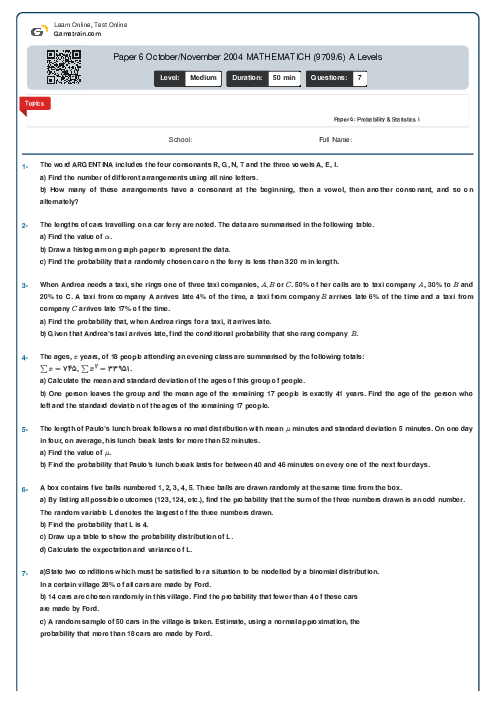
Paper 6 October/November 2004 MATHEMATICH (9709/6) A Levels
Cambridge
AS & A Level
Mathematics (9709)
بهمن
2004
شامل مباحث:
Paper 5: Probability & Statistics 1
تعداد سوالات: 7
سطح دشواری:
متوسط
شروع:
آزاد
پایان:
آزاد
مدت پاسخگویی:
50 دقیقه
رایگان
لطفا برای اطمینان از عملکرد و تجربه بهتر از مرورگرهای مدرن و به روز مانند کروم یا فایرفاکس استفاده کنید.
پیش نمایش صفحه اول فایل
 Danial Naderi
 On average, 2 apples out of 15 are classified as being underweight. Find the probability that in a random sample of 200 apples, the number of apples which are underweight is more than 21 and less than 35.

محتواهای آموزشی مشابه
فایل های پاورپوینت، ویدئو، صوتی، متنی و ...
پرسش و پاسخ های مشابه
سوال کنید یا به سوالات دیگران پاسخ دهید ...