9708/12 Economics Feb Mar 2020 Online Test | Cambridge AS and A Level MCQ
Cambridge
AS & A Level
Economics (9708)
خرداد
2020
مشاهده نمونه سوال
شامل مباحث:
AS Level
تعداد سوالات: 30
سطح دشواری:
متوسط
شروع:
آزاد
پایان:
آزاد
مدت پاسخگویی:
60 دقیقه
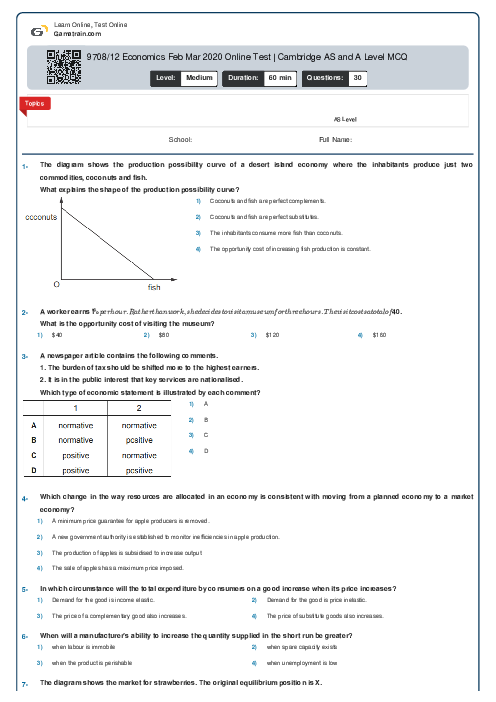
پیش نمایش صفحه اول فایل
A government introduces charges for vehicles using the roads in its capital city.
Which characteristic must the roads have for this to be successful in reducing congestion?

