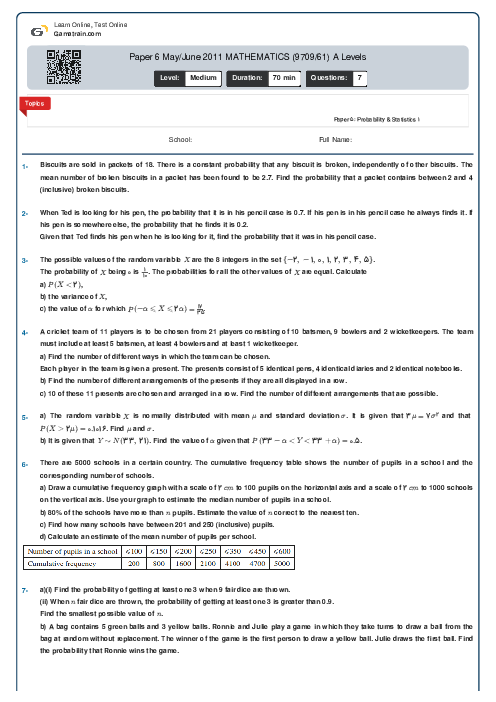
Paper 6 May/June 2011 MATHEMATICS (9709/61) A Levels
Cambridge
AS & A Level
Mathematics (9709)
شهریور
2011
مشاهده نمونه سوال
شامل مباحث:
Paper 5: Probability & Statistics 1
تعداد سوالات: 7
سطح دشواری:
متوسط
شروع:
آزاد
پایان:
آزاد
مدت پاسخگویی:
70 دقیقه
رایگان
لطفا برای اطمینان از عملکرد و تجربه بهتر از مرورگرهای مدرن و به روز مانند کروم یا فایرفاکس استفاده کنید.
پیش نمایش صفحه اول فایل
 Danial Naderi
 Human blood groups are identified by two parts. The first part is $A$, $B$, $AB$ or $O$ and the second part (the Rhesus part) is $ + $ or $-$. In the UK, 35% of the population are group $A + $, 8% are $B + $, 3% are $AB + $, 37% are $O + $, 7% are $A - $, 2% are $B - $, 1% are $AB - $ and 7% are $O - $.
a) A random sample of 9 people in the UK who are Rhesus $ + $ is taken. Find the probability that fewer than 3 are group $O + $.
b) A random sample…


محتواهای آموزشی مشابه
فایل های پاورپوینت، ویدئو، صوتی، متنی و ...
پرسش و پاسخ های مشابه
سوال کنید یا به سوالات دیگران پاسخ دهید ...