گاما رو نصب کن!

{{ number }}
اعلان ها
اعلان جدیدی وجود ندارد!
کاربر جدید

جستجو

پربازدیدها: #{{ tag.title }}

جستجوهای پرتکرار

میتونی لایو بذاری!
Economics (9708) 1403/11/30

9708/11 Economics Oct Nov 2017 Online Test | Cambridge AS and A Level MCQ

CIE AS & A Level Economics (9708) بهمن 2017 مشاهده نمونه سوال
شامل مباحث: AS Level
  تعداد سوالات: 30
  سطح دشواری: متوسط
  شروع: آزاد
  پایان: آزاد
  مدت پاسخگویی: 60 دقیقه
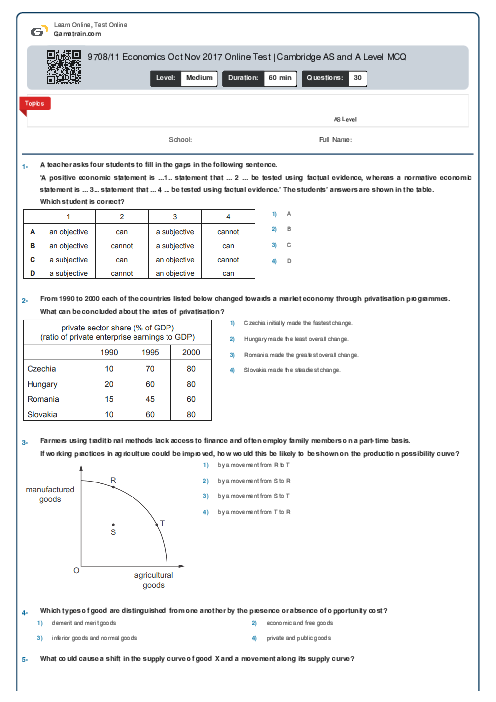
9708/11 Economics Oct Nov 2017 Online Test | Cambridge AS and A Level MCQ
پیش نمایش صفحه اول فایل
نوع: Paper 1
بروزرسانی شده در 30 بهمن 1403
  

In the diagram below D1 and S1 represent the demand and supply curves of a Malaysian industry in its home market. Equilibrium is at X. 
The industry has to pay a large wage increase and at the same time faces increased competition from imported substitutes.  
Which point, A, B, C, or D, on the diagram could represent the new equilibrium?