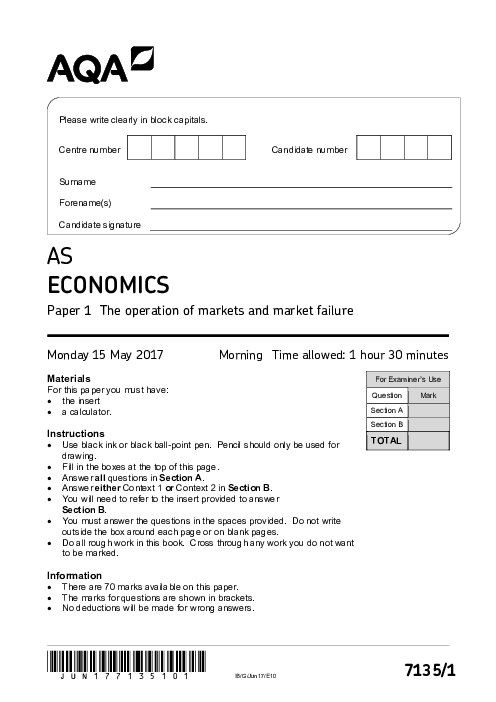
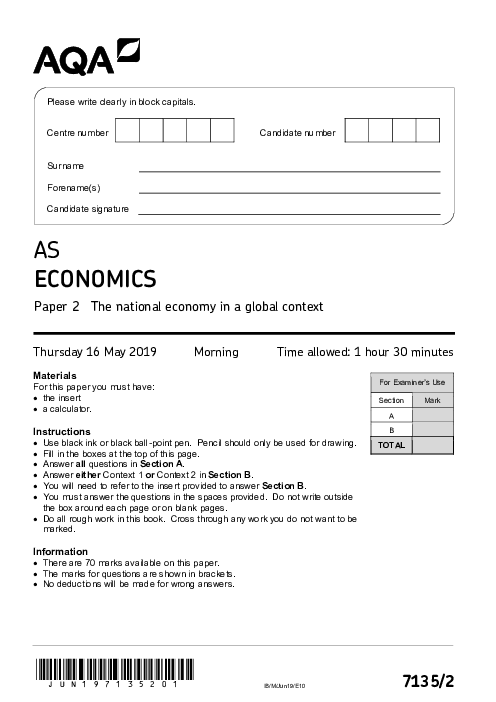
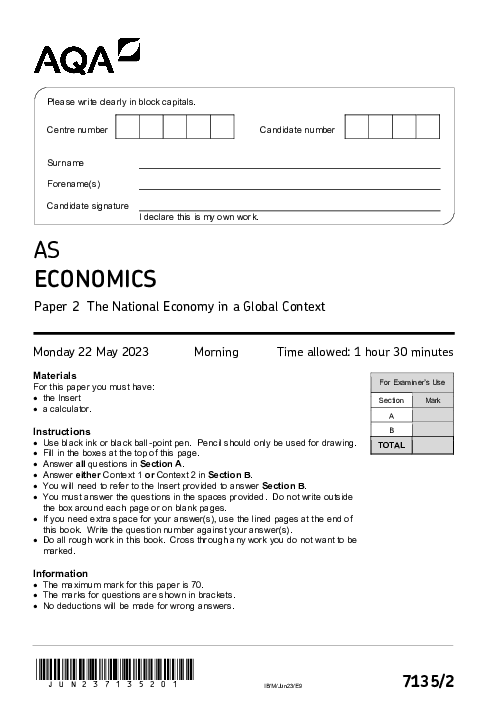
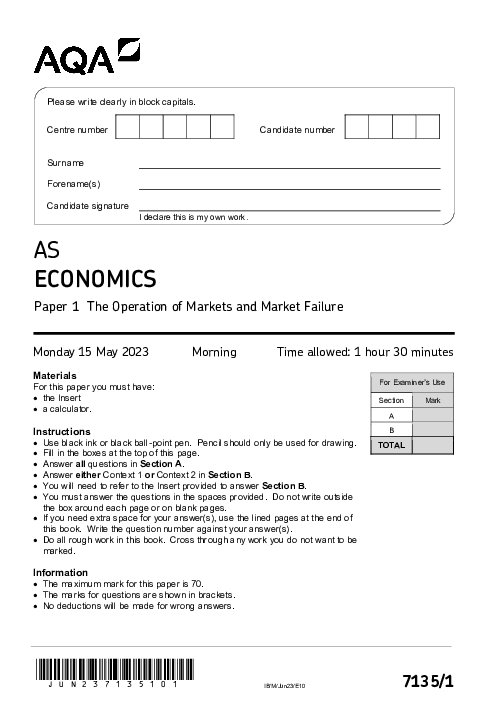
7135/2 Economics Jun 2022 Quiz | AQA AS Level MCQ
AQA
AS Level
Economics (7135)
شهریور
2022
مشاهده نمونه سوال
شامل مباحث:
تعداد سوالات: 20
سطح دشواری:
متوسط
شروع:
آزاد
پایان:
آزاد
مدت پاسخگویی:
25 دقیقه
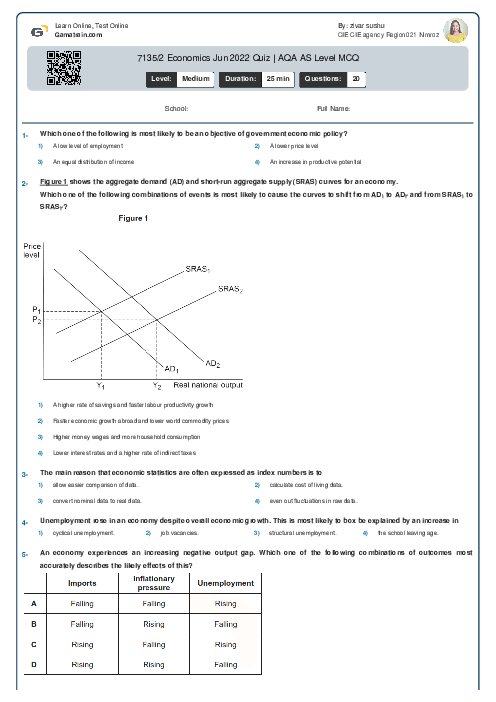
پیش نمایش صفحه اول فایل
The diagram below shows two production possibility frontiers (PPF) for an economy.
Which one of the following movements represents an economy that has experienced short-run but not long-run economic growth?

