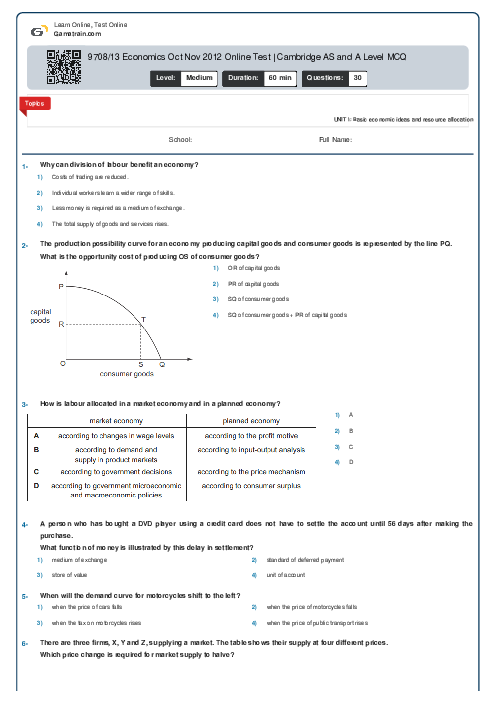
9708/13 Economics Oct Nov 2012 Online Test | Cambridge AS and A Level MCQ
Cambridge
AS & A Level
Economics (9708)
بهمن
2012
مشاهده نمونه سوال
شامل مباحث:
UNIT 1: Basic economic ideas and resource allocation
تعداد سوالات: 30
سطح دشواری:
متوسط
شروع:
آزاد
پایان:
آزاد
مدت پاسخگویی:
60 دقیقه
پیش نمایش صفحه اول فایل
 Neda Bani
 The diagram shows an initial market equilibrium for an agricultural product of $6 and 800 units.
How much will the government have to spend to increase the market price to $10?


پرسش و پاسخ های مشابه
سوال کنید یا به سوالات دیگران پاسخ دهید ...