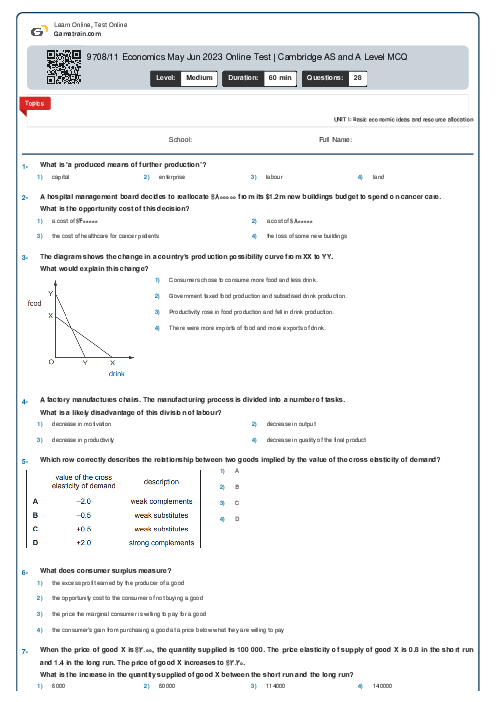
9708/11 Economics May Jun 2023 Online Test | Cambridge AS and A Level MCQ
Cambridge
AS & A Level
Economics (9708)
شهریور
2023
مشاهده نمونه سوال
شامل مباحث:
UNIT 1: Basic economic ideas and resource allocation
تعداد سوالات: 28
سطح دشواری:
متوسط
شروع:
آزاد
پایان:
آزاد
مدت پاسخگویی:
60 دقیقه
پیش نمایش صفحه اول فایل
 Neda Bani
 A country operates a floating exchange rate.
What will cause the demand curve for the country’s currency to shift left in the foreign exchange market?


پرسش و پاسخ های مشابه
سوال کنید یا به سوالات دیگران پاسخ دهید ...