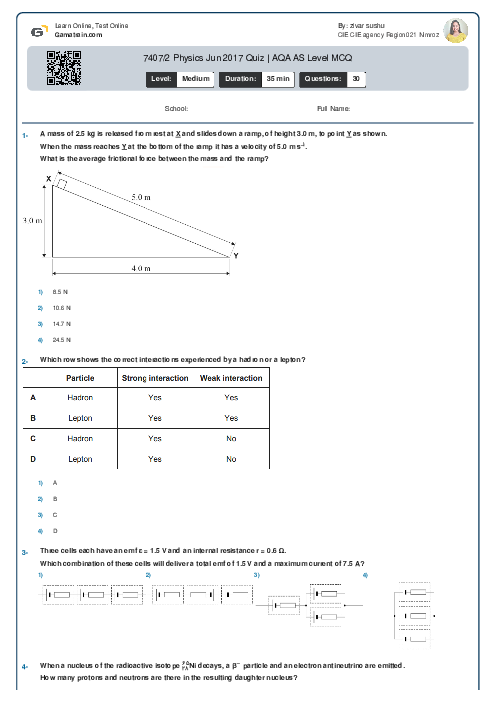
7407/2 Physics Jun 2017 Quiz | AQA AS Level MCQ
AQA
AS Level
Physics (7407)
شهریور
2017
مشاهده نمونه سوال
شامل مباحث:
تعداد سوالات: 30
سطح دشواری:
متوسط
شروع:
آزاد
پایان:
آزاد
مدت پاسخگویی:
35 دقیقه
پیش نمایش صفحه اول فایل
Resistors of resistance R, R and 3R are connected as shown.
What is the resistance of the arrangement?


پرسش و پاسخ های مشابه
سوال کنید یا به سوالات دیگران پاسخ دهید ...