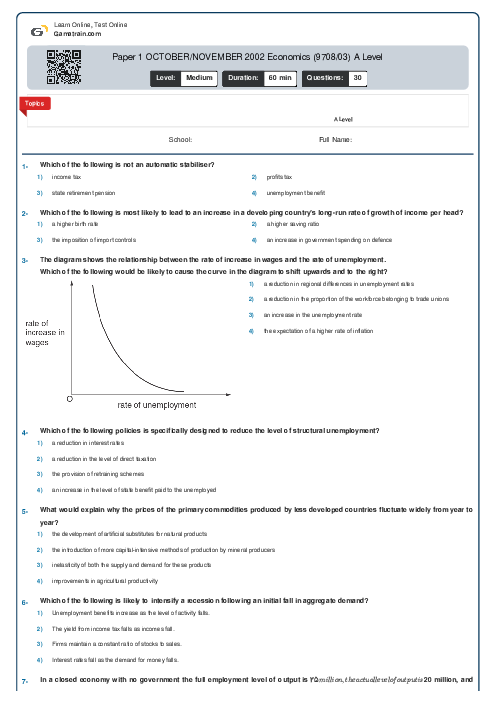
Paper 1 OCTOBER/NOVEMBER 2002 Economics (9708/03) A Level
Cambridge
AS & A Level
Economics (9708)
بهمن
2002
شامل مباحث:
A Level
تعداد سوالات: 30
سطح دشواری:
متوسط
شروع:
آزاد
پایان:
آزاد
مدت پاسخگویی:
60 دقیقه
پیش نمایش صفحه اول فایل
 Arefe Naderlouei
 The diagram shows an individual worker’s supply curve of labour.
The hourly wage is OW and the worker is required to work a standard 40-hour week.
Which area measures the difference between the total amount the worker is paid per week and the minimum amount he would be willing to accept?


پرسش و پاسخ های مشابه
سوال کنید یا به سوالات دیگران پاسخ دهید ...