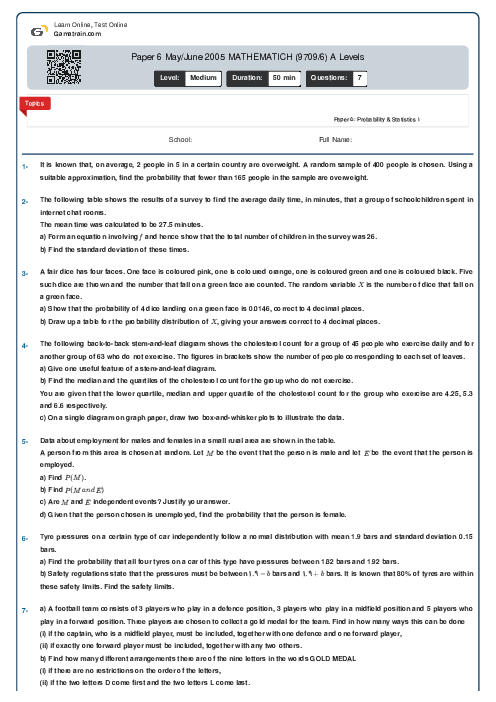
Paper 6 May/June 2005 MATHEMATICH (9709/6) A Levels
Cambridge
AS & A Level
Mathematics (9709)
شهریور
2005
شامل مباحث:
Paper 5: Probability & Statistics 1
تعداد سوالات: 7
سطح دشواری:
متوسط
شروع:
آزاد
پایان:
آزاد
مدت پاسخگویی:
50 دقیقه
رایگان
لطفا برای اطمینان از عملکرد و تجربه بهتر از مرورگرهای مدرن و به روز مانند کروم یا فایرفاکس استفاده کنید.
پیش نمایش صفحه اول فایل
 Danial Naderi
 Sanket plays a game using a biased die which is twice as likely to land on an even number as on an odd number. The probabilities for the three even numbers are all equal and the probabilities for the three odd numbers are all equal.
a) Find the probability of throwing an odd number with this die.
Sanket throws the die once and calculates his score by the following method.
- If the number thrown is 3 or less he multiplies the number…

محتواهای آموزشی مشابه
فایل های پاورپوینت، ویدئو، صوتی، متنی و ...
پرسش و پاسخ های مشابه
سوال کنید یا به سوالات دیگران پاسخ دهید ...