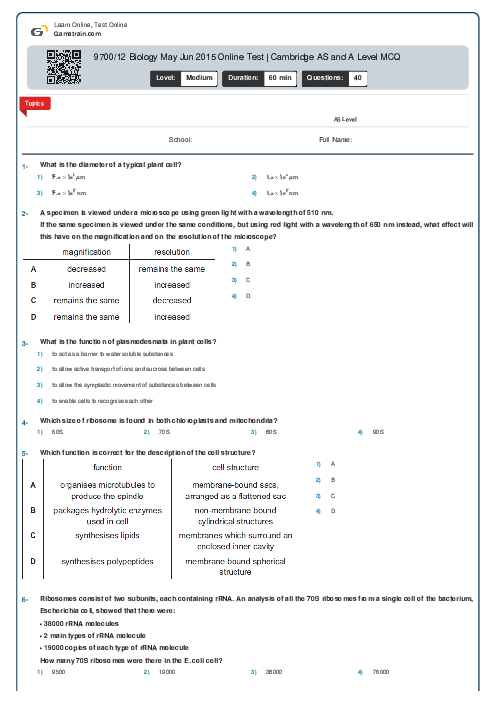
9700/12 Biology May Jun 2015 Online Test | Cambridge AS and A Level MCQ
Cambridge
AS & A Level
Biology (9700)
شهریور
2015
مشاهده نمونه سوال
شامل مباحث:
AS Level
تعداد سوالات: 40
سطح دشواری:
متوسط
شروع:
آزاد
پایان:
آزاد
مدت پاسخگویی:
60 دقیقه
پیش نمایش صفحه اول فایل
 Gama Admin
 Which diagram shows the bond linking the individual units of both cellulose and amylose?


پرسش و پاسخ های مشابه
سوال کنید یا به سوالات دیگران پاسخ دهید ...