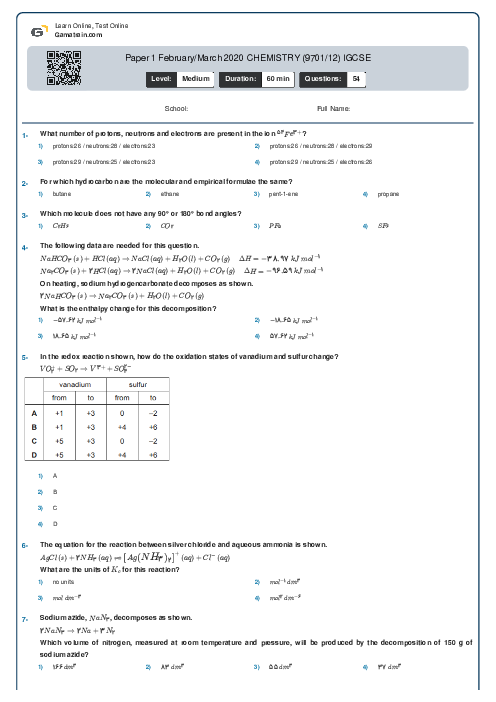
Paper 1 February/March 2020 CHEMISTRY (9701/12) IGCSE
Cambridge
AS & A Level
Chemistry (9701)
خرداد
2020
شامل مباحث:
تعداد سوالات: 54
سطح دشواری:
متوسط
شروع:
آزاد
پایان:
آزاد
مدت پاسخگویی:
60 دقیقه
پیش نمایش صفحه اول فایل
 Danial Naderi
ثبت شده در
5 بهمن 1401
What is the total number of protons, neutrons and electrons present in an ammonium ion with a relative formula mass of 21?