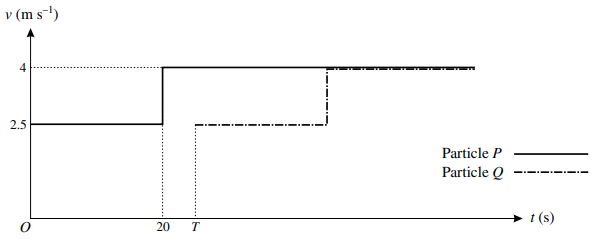
The diagram shows the velocity-time graphs for the motion of two particles $P$ and $Q$, which travel in the same direction along a straight line. $P$ and $Q$ both start at the same point $X$ on the line, but $Q$ starts to move $T{\text{ }}s$ later than $P$. Each particle moves with speed $2.5{\text{ }}m{\text{ }}{s^{ - 1}}$ motion. The speed of each particle changes instantaneously to $4{\text{ }}m{\text{ }}{s^{ - 1}}$ after it has been moving for $20{\text{ }}s$ and the particle continues at this speed.
a) Make a rough copy of the diagram and shade the region whose area represents the displacement of $P$ from $X$ at the instant when $Q$ starts.
It is given that $P$ has travelled $70{\text{ }}m$ at the instant when $Q$ starts.
b) Find the value of $T$.
c) Find the distance between $P$ and $Q$ when $Q’s$ speed reaches $4{\text{ }}m{\text{ }}{s^{ - 1}}$.
d) Sketch a single diagram showing the displacement-time graphs for both $P$ and $Q$, with values shown on the t-axis at which the speed of either particle changes.
پاسخ تشریحی :
تحلیل ویدئویی تست
منتظریم اولین نفر تحلیلش کنه!


محتواهای آموزشی مشابه
فایل های پاورپوینت، ویدئو، صوتی، متنی و ...
پرسش و پاسخ های مشابه
سوال کنید یا به سوالات دیگران پاسخ دهید ...