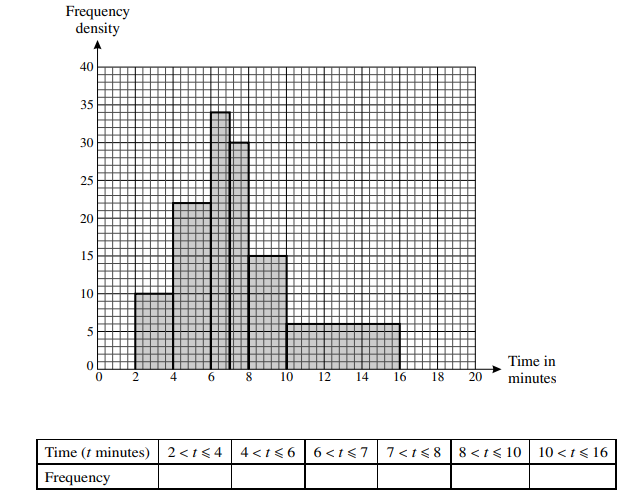
The following histogram illustrates the distribution of times, in minutes, that some students spent taking a shower.
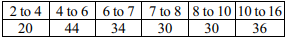
a) Copy and complete the following frequency table for the data.
b) Calculate an estimate of the mean time to take a shower.
c) Two of these students are chosen at random. Find the probability that exactly one takes between 7 and 10 minutes to take a shower.
پاسخ تشریحی :
تحلیل ویدئویی تست
منتظریم اولین نفر تحلیلش کنه!

محتواهای آموزشی مشابه
فایل های پاورپوینت، ویدئو، صوتی، متنی و ...
پرسش و پاسخ های مشابه
سوال کنید یا به سوالات دیگران پاسخ دهید ...