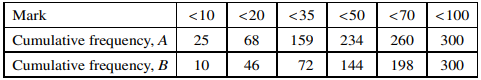
The following cumulative frequency table shows the examination marks for 300 candidates in country $A$ and 300 candidates in country $B$.
a) Without drawing a graph, show that the median for country $B$ is higher than the median for country $A$.
b) Find the number of candidates in country $A$ who scored between 20 and 34 marks inclusive.
c) Calculate an estimate of the mean mark for candidates in country $A$.
پاسخ تشریحی :
تحلیل ویدئویی تست
منتظریم اولین نفر تحلیلش کنه!


محتواهای آموزشی مشابه
فایل های پاورپوینت، ویدئو، صوتی، متنی و ...
پرسش و پاسخ های مشابه
سوال کنید یا به سوالات دیگران پاسخ دهید ...