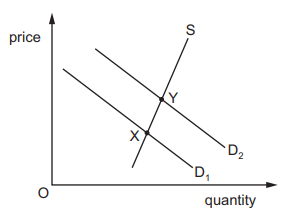
The diagram represents the market for electric cookers.
What is most likely to explain the change in the equilibrium from point X to point Y?
1 )
a fall in the price of electric cookers
2 )
an increase in a specific tax on electric cookers
an increase in the number of households
4 )
an increase in the price of electricity
تحلیل ویدئویی تست
منتظریم اولین نفر تحلیلش کنه!


پرسش و پاسخ های مشابه
سوال کنید یا به سوالات دیگران پاسخ دهید ...