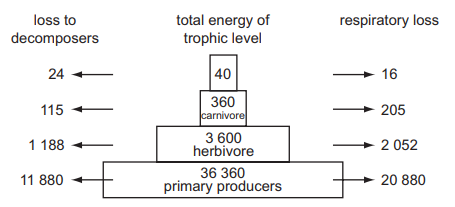
The diagram represents loss of energy from a food chain to decomposers, transfer of energy to the next trophic level and energy loss through respiration. All figures are in $kJ\,{m^{-2}}{y^{-1}}$.
What is illustrated by this diagram?
1 )
Carnivores lose more energy than herbivores.
2 )
Energy loss to decomposers is higher than respiratory loss.
Energy transfer between trophic levels is about 10%.
4 )
The energy of the final trophic level is not used.
تحلیل ویدئویی تست
منتظریم اولین نفر تحلیلش کنه!


پرسش و پاسخ های مشابه
سوال کنید یا به سوالات دیگران پاسخ دهید ...