Ethiopia is Africa’s largest producer of coffee. ${S_1}$ and ${D_1}$ are the original supply and demand curves for Ethiopian coffee. ${D_2}$ is a new demand curve.
What would have caused the change shown in the diagram?
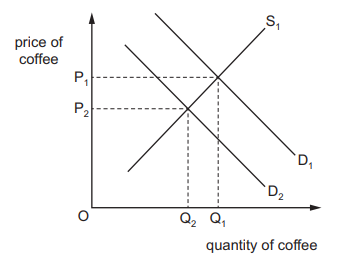
a fall in incomes worldwide
2 )
a fall in the cost of producing Ethiopian coffee
3 )
a rise in output from Ethiopian coffee harvests
4 )
a rise in the price of coffee produced in Kenya
تحلیل ویدئویی تست
منتظریم اولین نفر تحلیلش کنه!


پرسش و پاسخ های مشابه
سوال کنید یا به سوالات دیگران پاسخ دهید ...