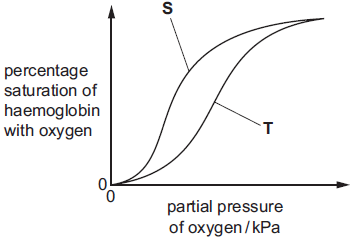
The graph shows the oxygen dissociation curves of haemoglobin from two species of mammal, S and T.
Which statements could explain the difference in the oxygen dissociation curves of species S and species T?
1) Species T has a lower haemoglobin concentration in its red blood cells than species S.
2) The haemoglobin in species T has a lower affinity for oxygen than the haemoglobin in species S.
3) Species T lives at higher altitudes than species S.
1 )
1, 2 and 3
2 )
1 and 2 only
2 only
4 )
3 only
تحلیل ویدئویی تست
منتظریم اولین نفر تحلیلش کنه!


پرسش و پاسخ های مشابه
سوال کنید یا به سوالات دیگران پاسخ دهید ...