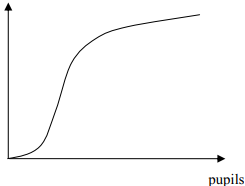
There are 5000 schools in a certain country. The cumulative frequency table shows the number of pupils in a school and the corresponding number of schools.
a) Draw a cumulative frequency graph with a scale of $2{\text{ }}cm$ to 100 pupils on the horizontal axis and a scale of $2{\text{ }}cm$ to 1000 schools on the vertical axis. Use your graph to estimate the median number of pupils in a school.
b) 80% of the schools have more than $n$ pupils. Estimate the value of $n$ correct to the nearest ten.
c) Find how many schools have between 201 and 250 (inclusive) pupils.
d) Calculate an estimate of the mean number of pupils per school.

پاسخ تشریحی :
تحلیل ویدئویی تست
منتظریم اولین نفر تحلیلش کنه!


محتواهای آموزشی مشابه
فایل های پاورپوینت، ویدئو، صوتی، متنی و ...
پرسش و پاسخ های مشابه
سوال کنید یا به سوالات دیگران پاسخ دهید ...