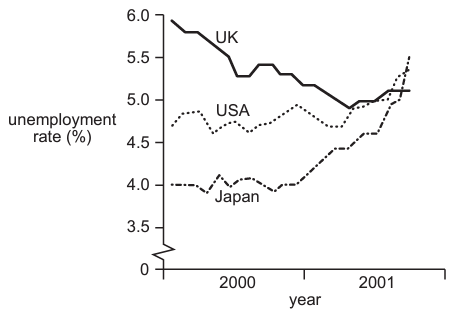
The graph shows the unemployment rates for the UK, USA and Japan for 2000 and 2001.
What can be concluded from the graph?
1 )
Each economy experienced a rising trend of unemployment.
2 )
Japan went from the lowest to the highest number of unemployed.
There was a trend towards more similar unemployment rates.
4 )
The UK had a higher number of unemployed than the USA.
تحلیل ویدئویی تست
منتظریم اولین نفر تحلیلش کنه!


پرسش و پاسخ های مشابه
سوال کنید یا به سوالات دیگران پاسخ دهید ...