The graph shows changes in the unemployment rates in countries X, Y and Z over the period 2000 to 2010. All three countries faced recession between 2008 and 2010.
Which conclusion can be drawn from the graph about the period 2000 to 2010?
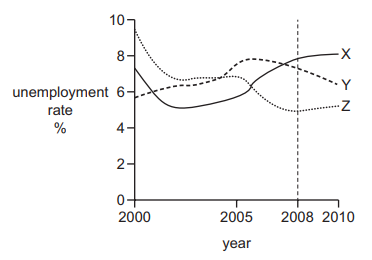
1 )
All three countries experienced an upward trend in unemployment over the period.
2 )
Country X had the highest number out of work in 2010.
In terms of unemployment, the country least harmed by the recession was country Y.
4 )
The total number out of work in the three countries was higher in 2010 than in 2000.
تحلیل ویدئویی تست
منتظریم اولین نفر تحلیلش کنه!


پرسش و پاسخ های مشابه
سوال کنید یا به سوالات دیگران پاسخ دهید ...