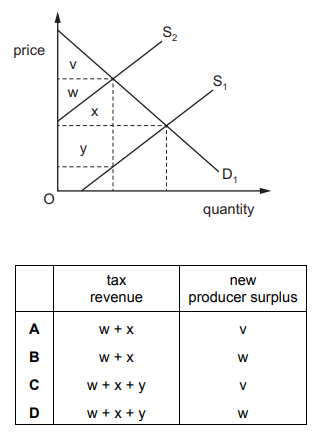
In the diagram ${D_1}$ is the demand curve for Indian tea and ${S_1}$ is the initial supply curve.
The Indian government imposes a tax on tea, which causes the supply curve to shift to ${S_2}$.
Which areas in the diagram measure the resulting tax revenue to the Indian government and the new producer surplus?
1 )
A
2 )
B
3 )
C
D
تحلیل ویدئویی تست
منتظریم اولین نفر تحلیلش کنه!


پرسش و پاسخ های مشابه
سوال کنید یا به سوالات دیگران پاسخ دهید ...