The table shows the weights used over three years in the UK consumer price index.
What can be deduced from the table?
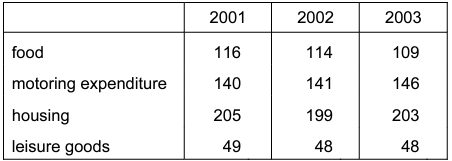
Housing was a bigger proportion of the average UK household’s spending in 2003 than in 2002.
2 )
The average UK household ate less in 2003 than in 2001.
3 )
The average UK household spent more on motoring in 2003 than in 2001.
4 )
The price of leisure goods remained unchanged between 2002 and 2003.
تحلیل ویدئویی تست
تحلیل ویدئویی برای این تست ثبت نشده است!


پرسش و پاسخ های مشابه
سوال کنید یا به سوالات دیگران پاسخ دهید ...