گاما رو نصب کن!

{{ number }}
اعلان ها
اعلان جدیدی وجود ندارد!
کاربر جدید

جستجو

پربازدیدها: #{{ tag.title }}

جستجوهای پرتکرار

میتونی لایو بذاری!

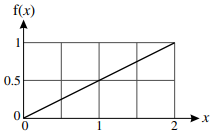
The diagram shows the graph of the probability density function, f, of a random variable $X$ which takes values between 0 and 2 only.

a) Find $P\left( {1 \lt X \lt 1.5} \right)$.

b) Find the median of $X$.

c) Find $E\left( X \right)$.

پاسخ تشریحی :
نمایش پاسخ

a) $0.5\left( {0.5 + 0.75} \right) \times 0.5$ or $\int_1^{1.5} {\frac{x}{2}dx} $

$ = {\raise0.5ex\hbox{$\scriptstyle 5$}
\kern-0.1em/\kern-0.15em
\lower0.25ex\hbox{$\scriptstyle {16}$}}$ or $0.3125$ or $0.313$

b) ${\raise0.5ex\hbox{$\scriptstyle 1$}
\kern-0.1em/\kern-0.15em
\lower0.25ex\hbox{$\scriptstyle 2$}}m \times {\raise0.5ex\hbox{$\scriptstyle m$}
\kern-0.1em/\kern-0.15em
\lower0.25ex\hbox{$\scriptstyle 2$}}$ or $\int_0^m {\frac{x}{2}dx} $

$ = {\raise0.5ex\hbox{$\scriptstyle 1$}
\kern-0.1em/\kern-0.15em
\lower0.25ex\hbox{$\scriptstyle 2$}}$

$m = \surd 2$ or $1.41$

c) $\int_0^2 {\frac{{{x^2}}}{2}dx} $

$ = {\raise0.5ex\hbox{$\scriptstyle 4$}
\kern-0.1em/\kern-0.15em
\lower0.25ex\hbox{$\scriptstyle 3$}}$ oe

تحلیل ویدئویی تست

تحلیل ویدئویی برای این تست ثبت نشده است!