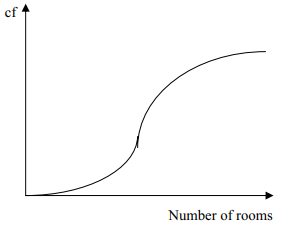
A hotel has 90 rooms. The table summarises information about the number of rooms occupied each day for a period of 200 days.
a) Draw a cumulative frequency graph on graph paper to illustrate this information.
b) Estimate the number of days when over 30 rooms were occupied.
c) On 75% of the days at most $n$ rooms were occupied. Estimate the value of $n$.

پاسخ تشریحی :
تحلیل ویدئویی تست
منتظریم اولین نفر تحلیلش کنه!


محتواهای آموزشی مشابه
فایل های پاورپوینت، ویدئو، صوتی، متنی و ...
پرسش و پاسخ های مشابه
سوال کنید یا به سوالات دیگران پاسخ دهید ...